Effective scrap collection in production: How to reduce waste and save costs

|
|
|
Hardly anything captures the attention of company management as much as high scrap rates. The reason: Quality losses are among the most expensive losses in general, as a large part of the value creation that has already occurred suddenly becomes worthless.
But what exactly falls under the category of "scrap"? And how can active efforts be made to reduce the scrap rate? We explain the concept of quality losses, demonstrate how scrap metrics are calculated, and examine strategies for reducing scrap on your shop floor.
Learn more about OEE software and the calculation of OEE in the linked articles.
What are quality losses?
Quality losses illustrate the production losses due to defective parts. "Defective" here refers to all manufactured workpieces that do not meet the minimum quality standards to be delivered to the customer.
In the context of “first pass yield,” only parts without errors in the first production run are considered good products.
This means: Both parts that cannot be reworked (“scrap,” e.g., defective surfaces or incorrect tolerances), as well as workpieces that can be "saved" with reworking, are considered scrap.
In terms of the 6 Big Losses, quality losses are divided into two categories: Start-up Scrap and Running Scrap.

Start-up Scrap
After setup, many machines require a certain amount of time and material until the manufacturing process runs stably, the previous material is depleted, or the quality of the process has been checked and approved (example: imprinting). The scrap that occurs until the process runs stably is referred to as start-up scrap.
Running Scrap
Running scrap, on the other hand, occurs while the process runs stably. Examples include manufacturing outside of tolerances or too many defects in the final product.

What information must be recorded in the case of scrap?
To subsequently allow for a meaningful analysis of scrap, the following information should be recorded:
Amount of scrap
Scrap category: Start-up or Running Scrap
Reason for scrap
Order and product information
Employee
Additional description (e.g., comments on further observations) (Optional)
It is important in this context that the scrap is recorded individually for each scrap event, i.e., for each quantity of produced scrap, the amount and an individual reason should be documented.
Only this approach allows for a granular analysis of scrap. If scrap quantities are only recorded at the order/batch level, for example, no distinction between start-up and running scrap can be made. This makes the analysis of causes impossible.
Benefits of a standardized scrap catalog
Like with downtimes, it pays to provide reasons to enable later analyses. The scrap should always be divided at least into the two categories of start-up scrap and running scrap. Within these categories, further groups and individual scrap reasons can then be established. How detailed this is done is decided individually. However, one should at least be able to recognize the most common causes of scrap in order to initiate countermeasures.
To provide a good start, we work with our clients in an onboarding discussion to create an initial scrap catalog. This will then be iteratively refined over time by the production team. To facilitate this, we at ENLYZE have placed great importance on ensuring that the catalog can be adjusted without IT support. This allows for quick adjustments at no additional cost.
Are you wondering what a scrap catalog would look like for you? Feel free to contact us via email so we can discuss your specific case: hello@enlyze.com, subject: Scrap Catalog.
After creating the downtime catalog, scrap quantities can be assigned to individual reasons:

How is the quality factor calculated?
The quality factor relates the quantity of good products manufactured to the total quantity produced:

The calculation of the scrap rate corresponds to the relationship between the quantity of scrap produced and the total quantity manufactured:

What are the challenges in capturing quality losses?
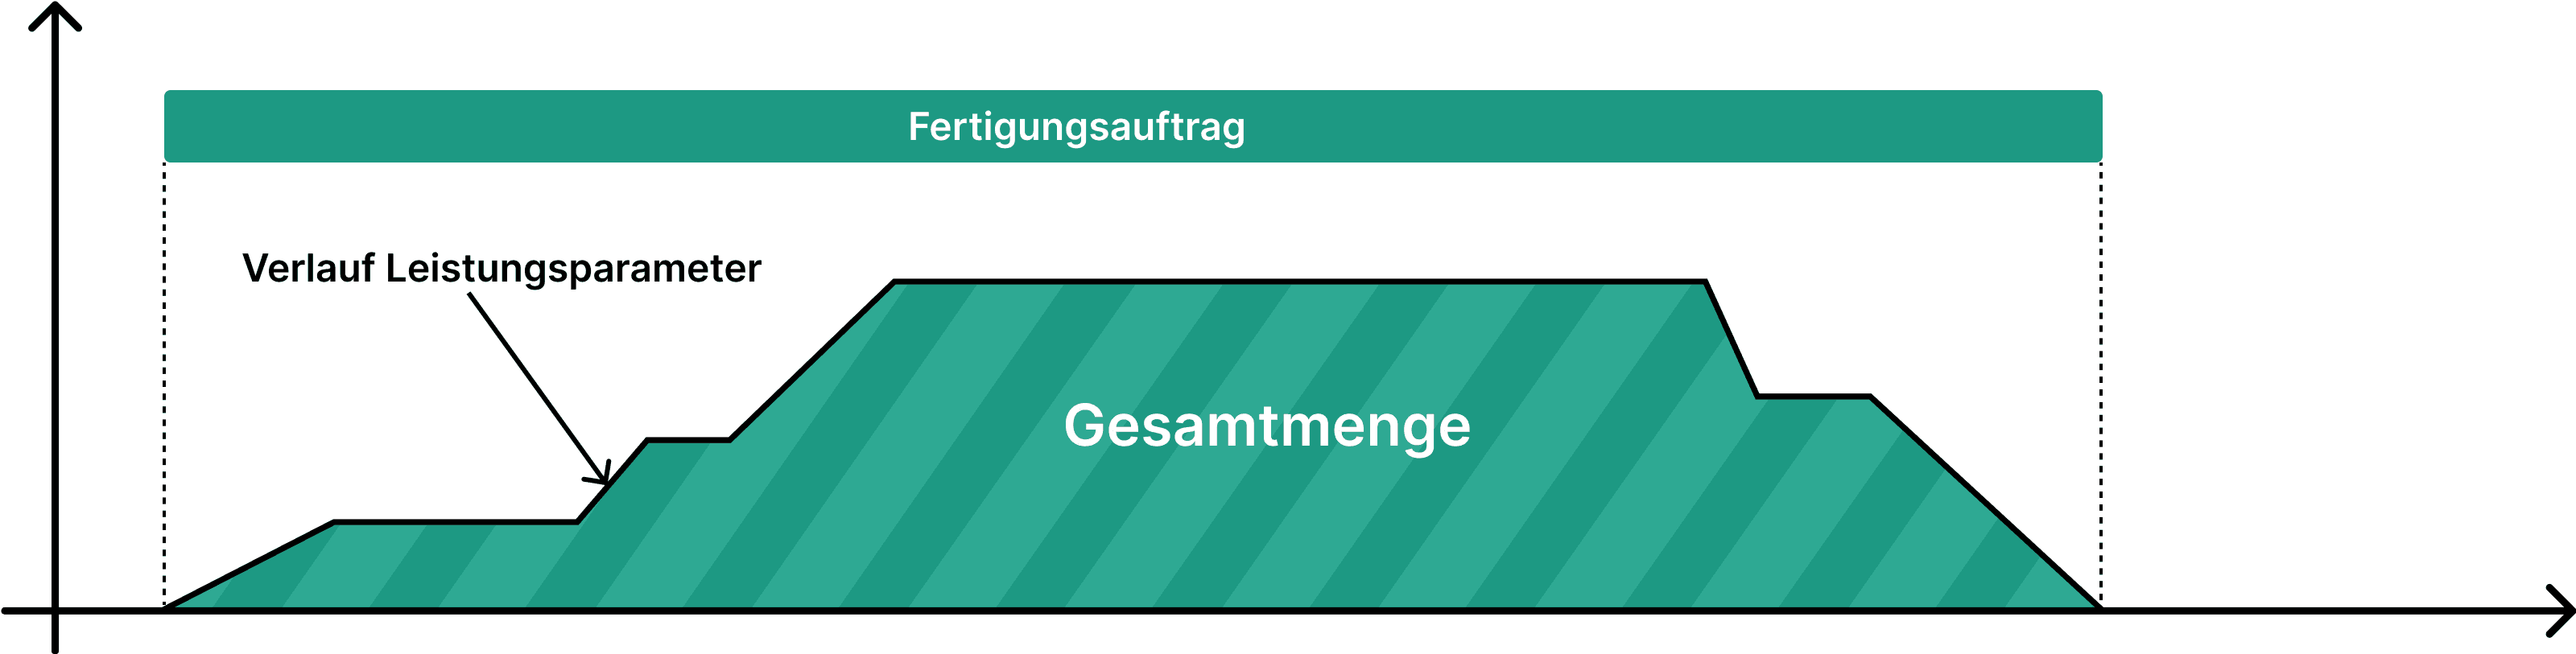
To determine quality losses, not only must the quantity of scrap but also the total amount of actual material used for each order be determined. However, this actual total quantity is rarely recorded accurately today and is often based on figures from production planning.
The problem:
The figures from production planning and reality often diverge. The discrepancy between planned and actual total amounts is sometimes so large that the inventory is depleted. The lack of transparency regarding real material consumption makes it impossible to determine a meaningful quality factor. Again, it helps to accurately capture the actual production reality based on machine data.
The solution:
A constant performance monitoring of the system using the start and end times of an order provides insight into this manufactured reality: When was produced, how much was produced. By integrating this performance curve, you accurately obtain the actual material usage.
Once again, inaccurate data collection today obstructs clean calculation. With the correct total amount of raw materials used and the scrap bookings, the scrap rate, the quality factor, and the quality losses can be accurately determined.
Another challenge arises from when a potential quality problem and, thus, scrap is detected. There is scrap that only becomes apparent during quality control later, which again means that adjustments to the scrap figures and other metrics must be possible throughout the entire lifecycle of the order.
What are the causes of scrap?
The good news: All causes can be comparatively easily addressed. In particular, using machine data makes it easier than ever to capture and avoid quality losses.
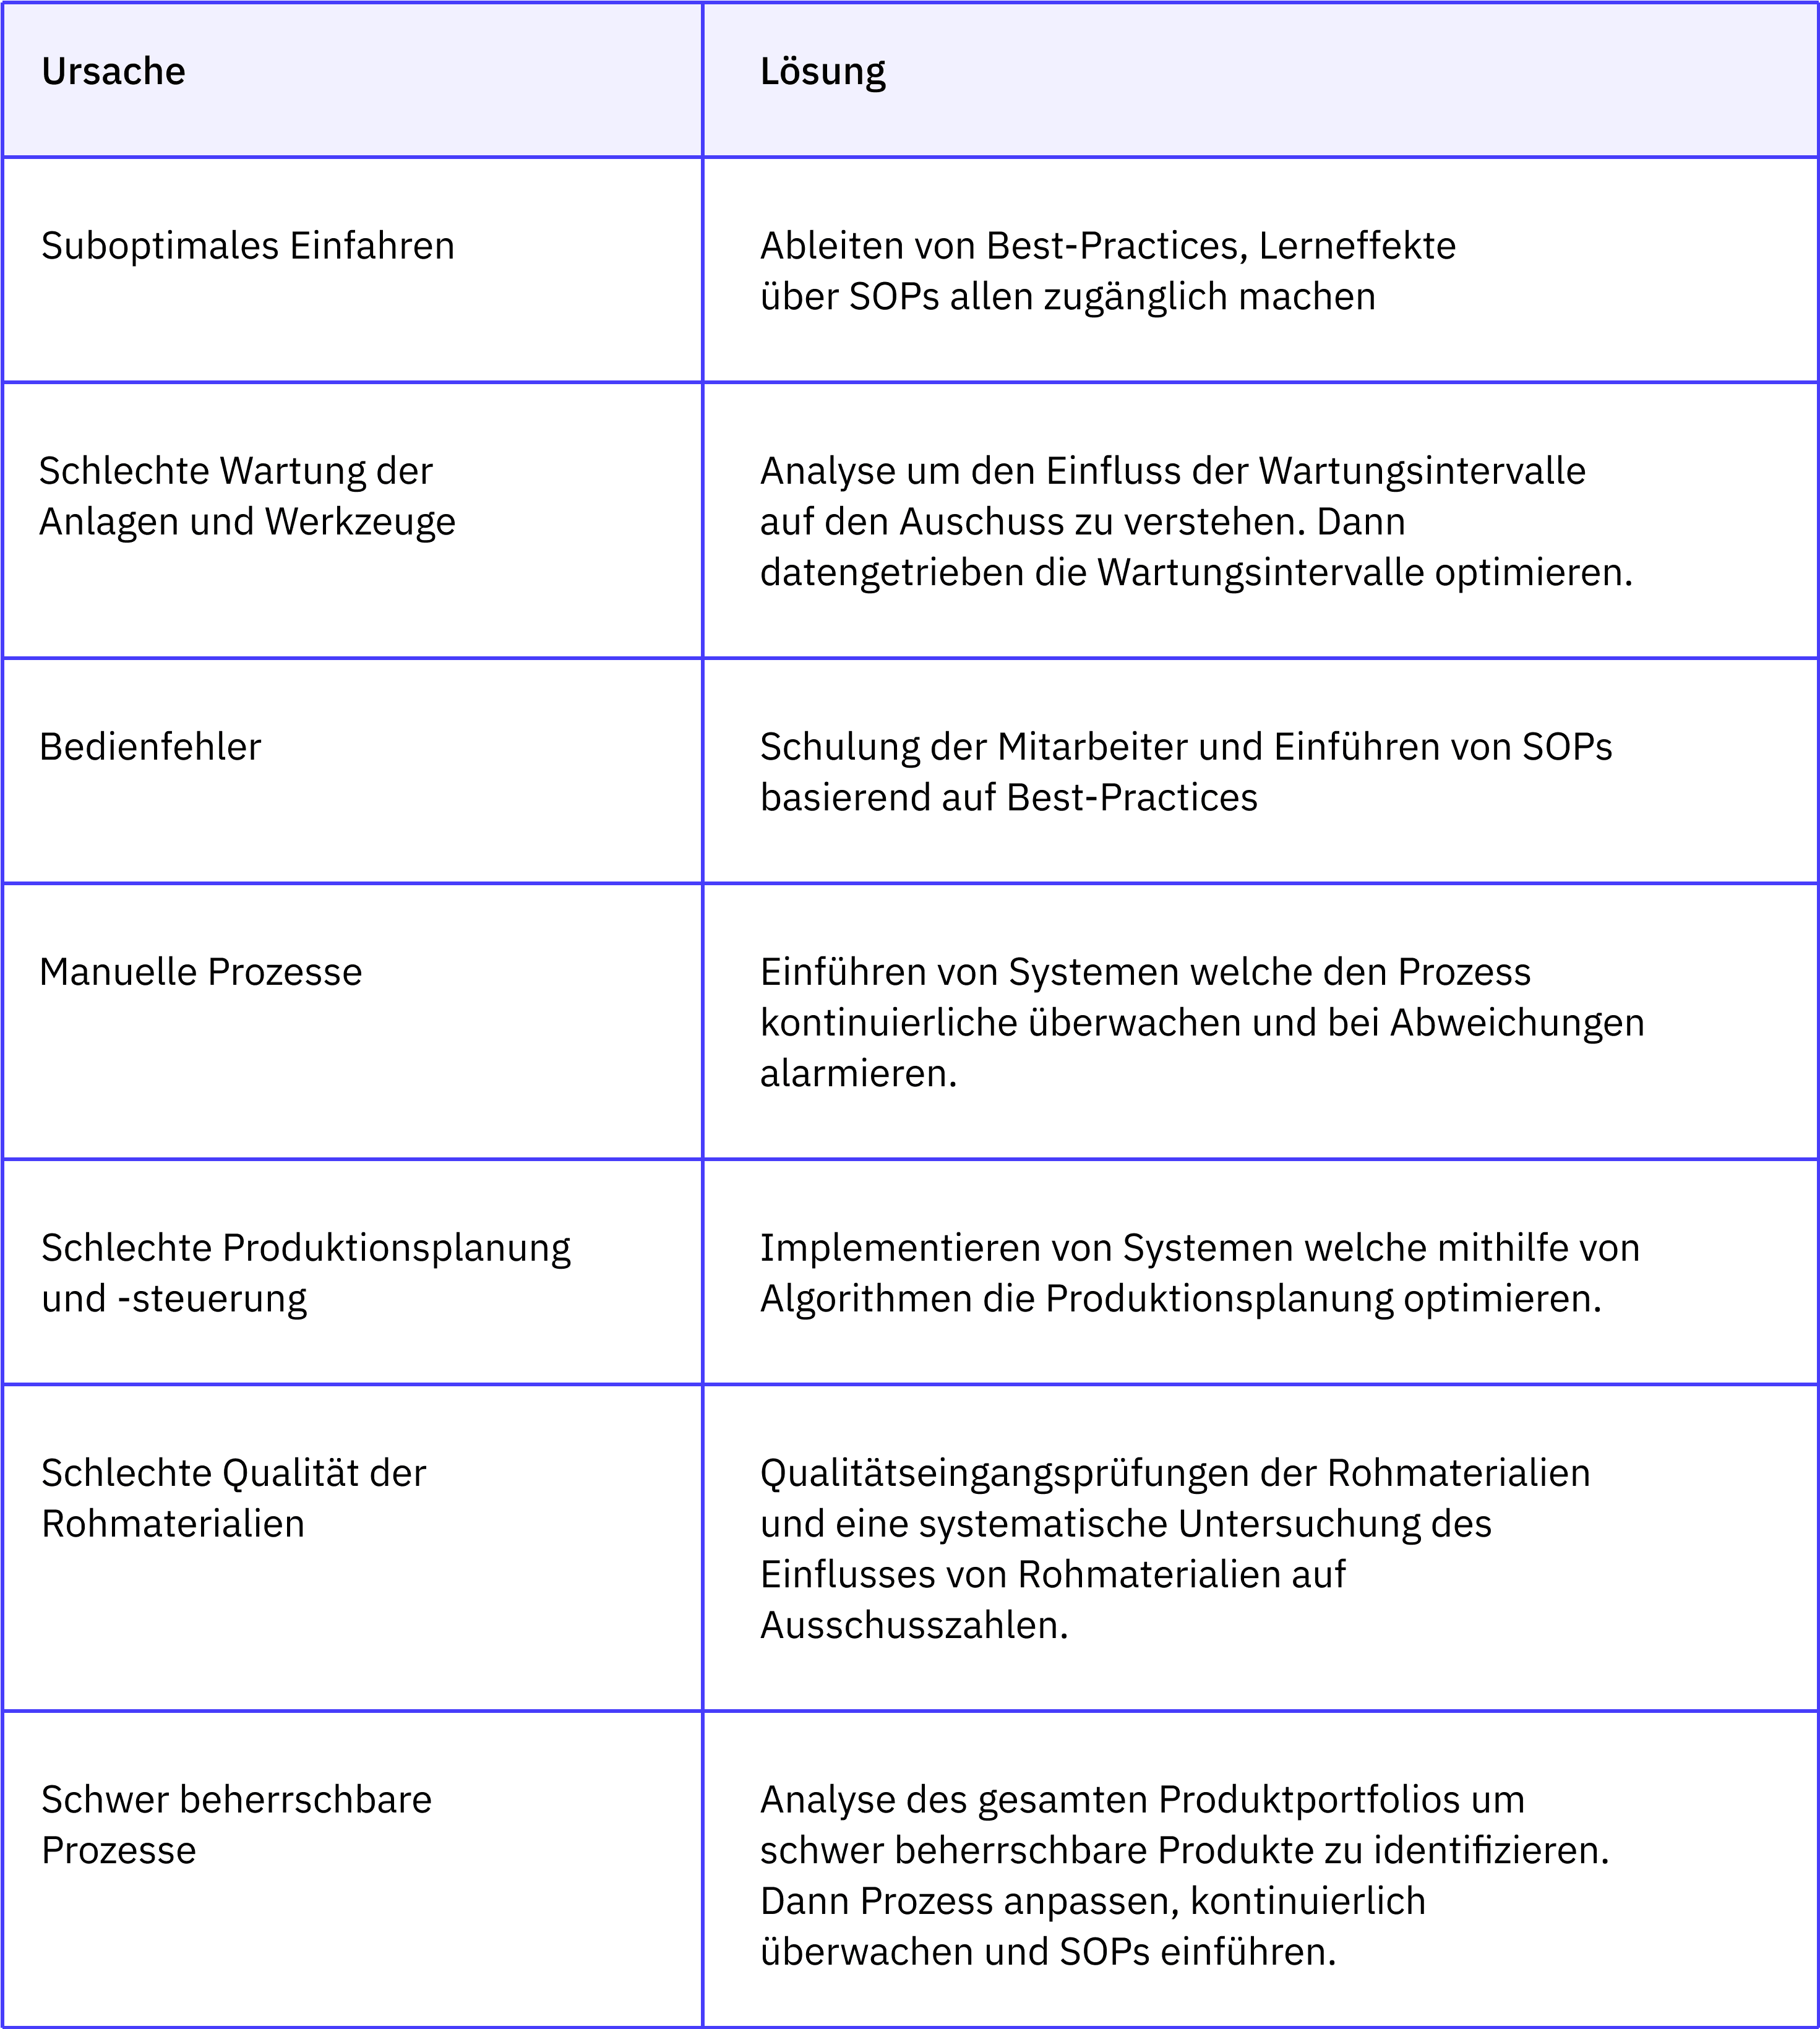
Suboptimal start-up or setup of the machines
After setting up, many machines need a certain amount of time and material before they can run stably. This scrap at the start of production can never be completely avoided, but it can be significantly reduced. Due to non-ideal start-up scenarios, the start-up process often takes longer than necessary and produces unnecessary start-up scrap. A good assessment of potential optimization can be achieved through analysis of variations in start-up times and start-up scrap.
Solution:
Through analysis, best practices for the optimal parameters for start-up can be derived. By implementing standard operating procedures (SOPs), all workers have access to these best practices and can apply them. This leads to less variability in start-up times and a reduction in start-up scrap.
It is extremely important to engage the workers here and to raise awareness. The following questions must be clarified with the shop floor personnel:
Why are the SOPs being introduced?
How were these SOPs derived?
What do you hope to achieve with them or
What goals are to be reached with the SOPs?
A good data foundation helps with all these questions to transparently showcase the necessary information and derived measures.
Poor maintenance of machines and tools
Poor maintenance of machines and tools affects the scrap rate in multiple ways. Poor maintenance leads to suboptimal process flows, increasing running scrap. Possible unplanned downtimes upon discovering these errors not only reduce availability (and thus OEE) but also again lead to increased start-up scrap when restarting the machine after the downtime.
Solution:
Using data and historical comparison values, ideal maintenance intervals can be derived. This approach reduces unplanned downtimes and thus downtime and scrap. The basis for this is a clean recording of maintenance activities as well as downtimes and the resulting scrap production.
Operator errors
Operator errors often lead to non-ideal and variable processes. They promote manufacturing outside tolerances and process defects such as speckling, ultimately resulting in scrap, longer start-up times, and unnecessary emergency stops.
Solution:
The largest leverage lies in continuous training of the staff. Data can help illustrate the actual size of the problem and get everyone on board. Moreover, there is once again the possibility of working with SOPs and continuously improving them. The Co-Pilot from ENLYZE also provides an option, alerting to fluctuating and incorrect process parameters.
Manual processes
Manual data collection does not allow for continuous monitoring of the manufacturing process. This can lead to deviations going unnoticed for long periods, resulting in unnecessary scrap production.
Solution:
By continuously monitoring all relevant process parameters instead of manual sampling, problems are recognized faster and countermeasures are initiated earlier. Often, early intervention can completely prevent scrap.
Poor production planning and control (PPS)
Good pre-planning in PPS has a significant impact on start-up scrap. When the production program is well planned, a product change can be made without major scrap production. However, if production is poorly planned, for example, due to the wrong sequence of colors of different products, this can have a significant impact on scrap due to flushing.
However, color is only one of many relevant parameters that must be taken into account. In reality, several dozen parameters must be considered in optimization to find errors and identify the necessary levers.
Solution:
Production planning is a highly complex optimization problem with many different input variables. Today, it is often still done manually, usually by a person without any technical assistance.
However, we as humans are not equipped to solve such high-dimensional optimization problems. At least not in the way modern statistical or AI-based algorithms can. However, to apply these and train AI models, the necessary data is still lacking today. Machine data capture can record the necessary training data and make it available for production planning. The AI can then solve this optimization problem in favor of a lower start-up scrap and thus suggest an optimized production plan.
Poor quality of raw materials
The quality of the raw materials used has a significant impact on the manufacturing process. Poor quality raw materials lead to significantly less stable or more variable and thus harder to control processes.
Defective and inferior raw materials primarily contribute to running scrap. However, poorer raw materials also increase maintenance-related downtimes due to increased wear and contamination. The probability of process-related stops and thus scrap during start-up should not be underestimated.
Solution:
A correlation analysis of used raw materials and scrap can lead to interesting insights for both new and old materials. For example, one of our customers bought identical raw materials from different manufacturers. The production manager mentioned to us in a conversation:
“The raw material from Manufacturer X always seems to run better than the others.”
We conducted a correlation analysis between used raw materials, production speeds, and scrap, and behold: The production manager's assumption was clearly confirmed.
The production speeds were higher
The processes were less variable
And the scrap was lower.
Even before ENLYZE, the production manager had tried to prefer buying raw materials from this manufacturer. However, due to the higher price, there were always obstacles to approval. With the now conducted analysis, the advantages could be objectively demonstrated, a ROI analysis conducted, and ultimately the high-quality supplier selected.
Difficult-to-control processes
Some manufacturing processes seem inherently difficult to control, for example due to strong process fluctuations. Running and start-up scrap often spike here.
Solution:
A product portfolio analysis shows which products produce above-average amounts of scrap. Because: Much scrap isn’t always bad. Some products are inherently more difficult to produce, resulting in high scrap being factored into the selling price. In this case, scrap is not a problem from a financial perspective.
The goal of the product portfolio analysis is to identify the “problematic products” with high scrap. If there are products here that should run more stably, improvements must be made.
Summary
Scrap is the most expensive loss factor, so even small improvements have a significant financial benefit. To target the right areas, it is also important to first accurately capture the status quo regarding scrap in order to identify the biggest leverage points.
To accurately capture the causes of scrap, a systematic catalog of scrap reasons should be established, including the two categories of start-up scrap and ongoing scrap. If the scrap reasons are applied correctly, one can quickly achieve success with the presented action catalog and demonstrate this through an improvement in scrap rates.
To accurately capture quality losses, it is particularly important to accurately record the actual amount of material used. Many companies often fail here because they rely on the planned quantities. Accurate recording is only possible through continuous monitoring of machine performance.
We would be happy to show you in a demo how to capture quality losses and create a scrap catalog.
Next week, things will get more strategic. We will discuss how OEE and the 6 Big Losses can be used for deriving the digitalization strategy.
Become an OEE Expert with Our OEE Series
Here you will learn how to calculate and improve OEE in the long term.
Read more


