OEE Dashboards: 4 Examples with Excel, PowerBI, Grafana & Co.

|
|
|
To uncover potential in manufacturing, producing companies need insight into the quality and effectiveness of their plants. For this purpose, the OEE metric is suitable, which is calculated from availability, product quality, and performance. The OEE is now used in many companies to determine the effectiveness of production lines.
However, the metric alone has little meaning if it is not made adequately visible and integrated into production management.
Therefore, in this article, we will show you some visualization options for the OEE metric and its components.
The dashboards presented are suitable for both continuous monitoring and retrospective summaries of the effectiveness of your production lines.
More on the topic: 5 dashboards that no production should be without

Which tool is suitable for creating OEE dashboards?
"A well-designed dashboard allows a manager to answer a question in eight seconds or less." - Stephen Few, author of the books 'Information Dashboard Design' and 'Show Me the Numbers'
This is truer than ever in the digital age. That's why it's important to rely on the right software with high functionality and ease of use when creating a dashboard.
1. Excel
Ideal for beginners with limited technical resources. It is widespread, and hardly any company works without Excel. However, it requires significant manual effort to maintain current data and calculate the OEE effectively.
Here you can get a free Excel template for OEE calculation.
2. PowerBI
A robust solution for those who have already invested in Microsoft's ecosystem. It offers sophisticated visualization options and is compatible with ENLYZE, allowing users to quickly and seamlessly access real-time data.
3. Grafana
Well suited for advanced users who already have extensive data sources and want to perform complex time series analyses. Grafana supports dynamic dashboards that are ideal for displaying OEE data in real time, especially in conjunction with ENLYZE.
4. ENLYZE
For those who want to eliminate the tedious and time-consuming OEE calculation from their workflow and also gain access to easily understandable KPI visualizations, ENLYZE is the ideal choice.
Today, at least 4 different machine data solutions must be integrated to utilize machine data. This integration takes time and money.
We at ENLYZE avoid this problem by bundling the 4 products into one product. As a result, you have no lengthy IT project with high costs, but rather a product that works from day one.
What should OEE dashboards look like?
After selecting the appropriate software, the question remains of how to visualize the OEE in the most comprehensible way. Therefore, we will present four dashboards with the most important KPIs and visualization methods.
1. OEE Overview
(Example: ENLYZE App)
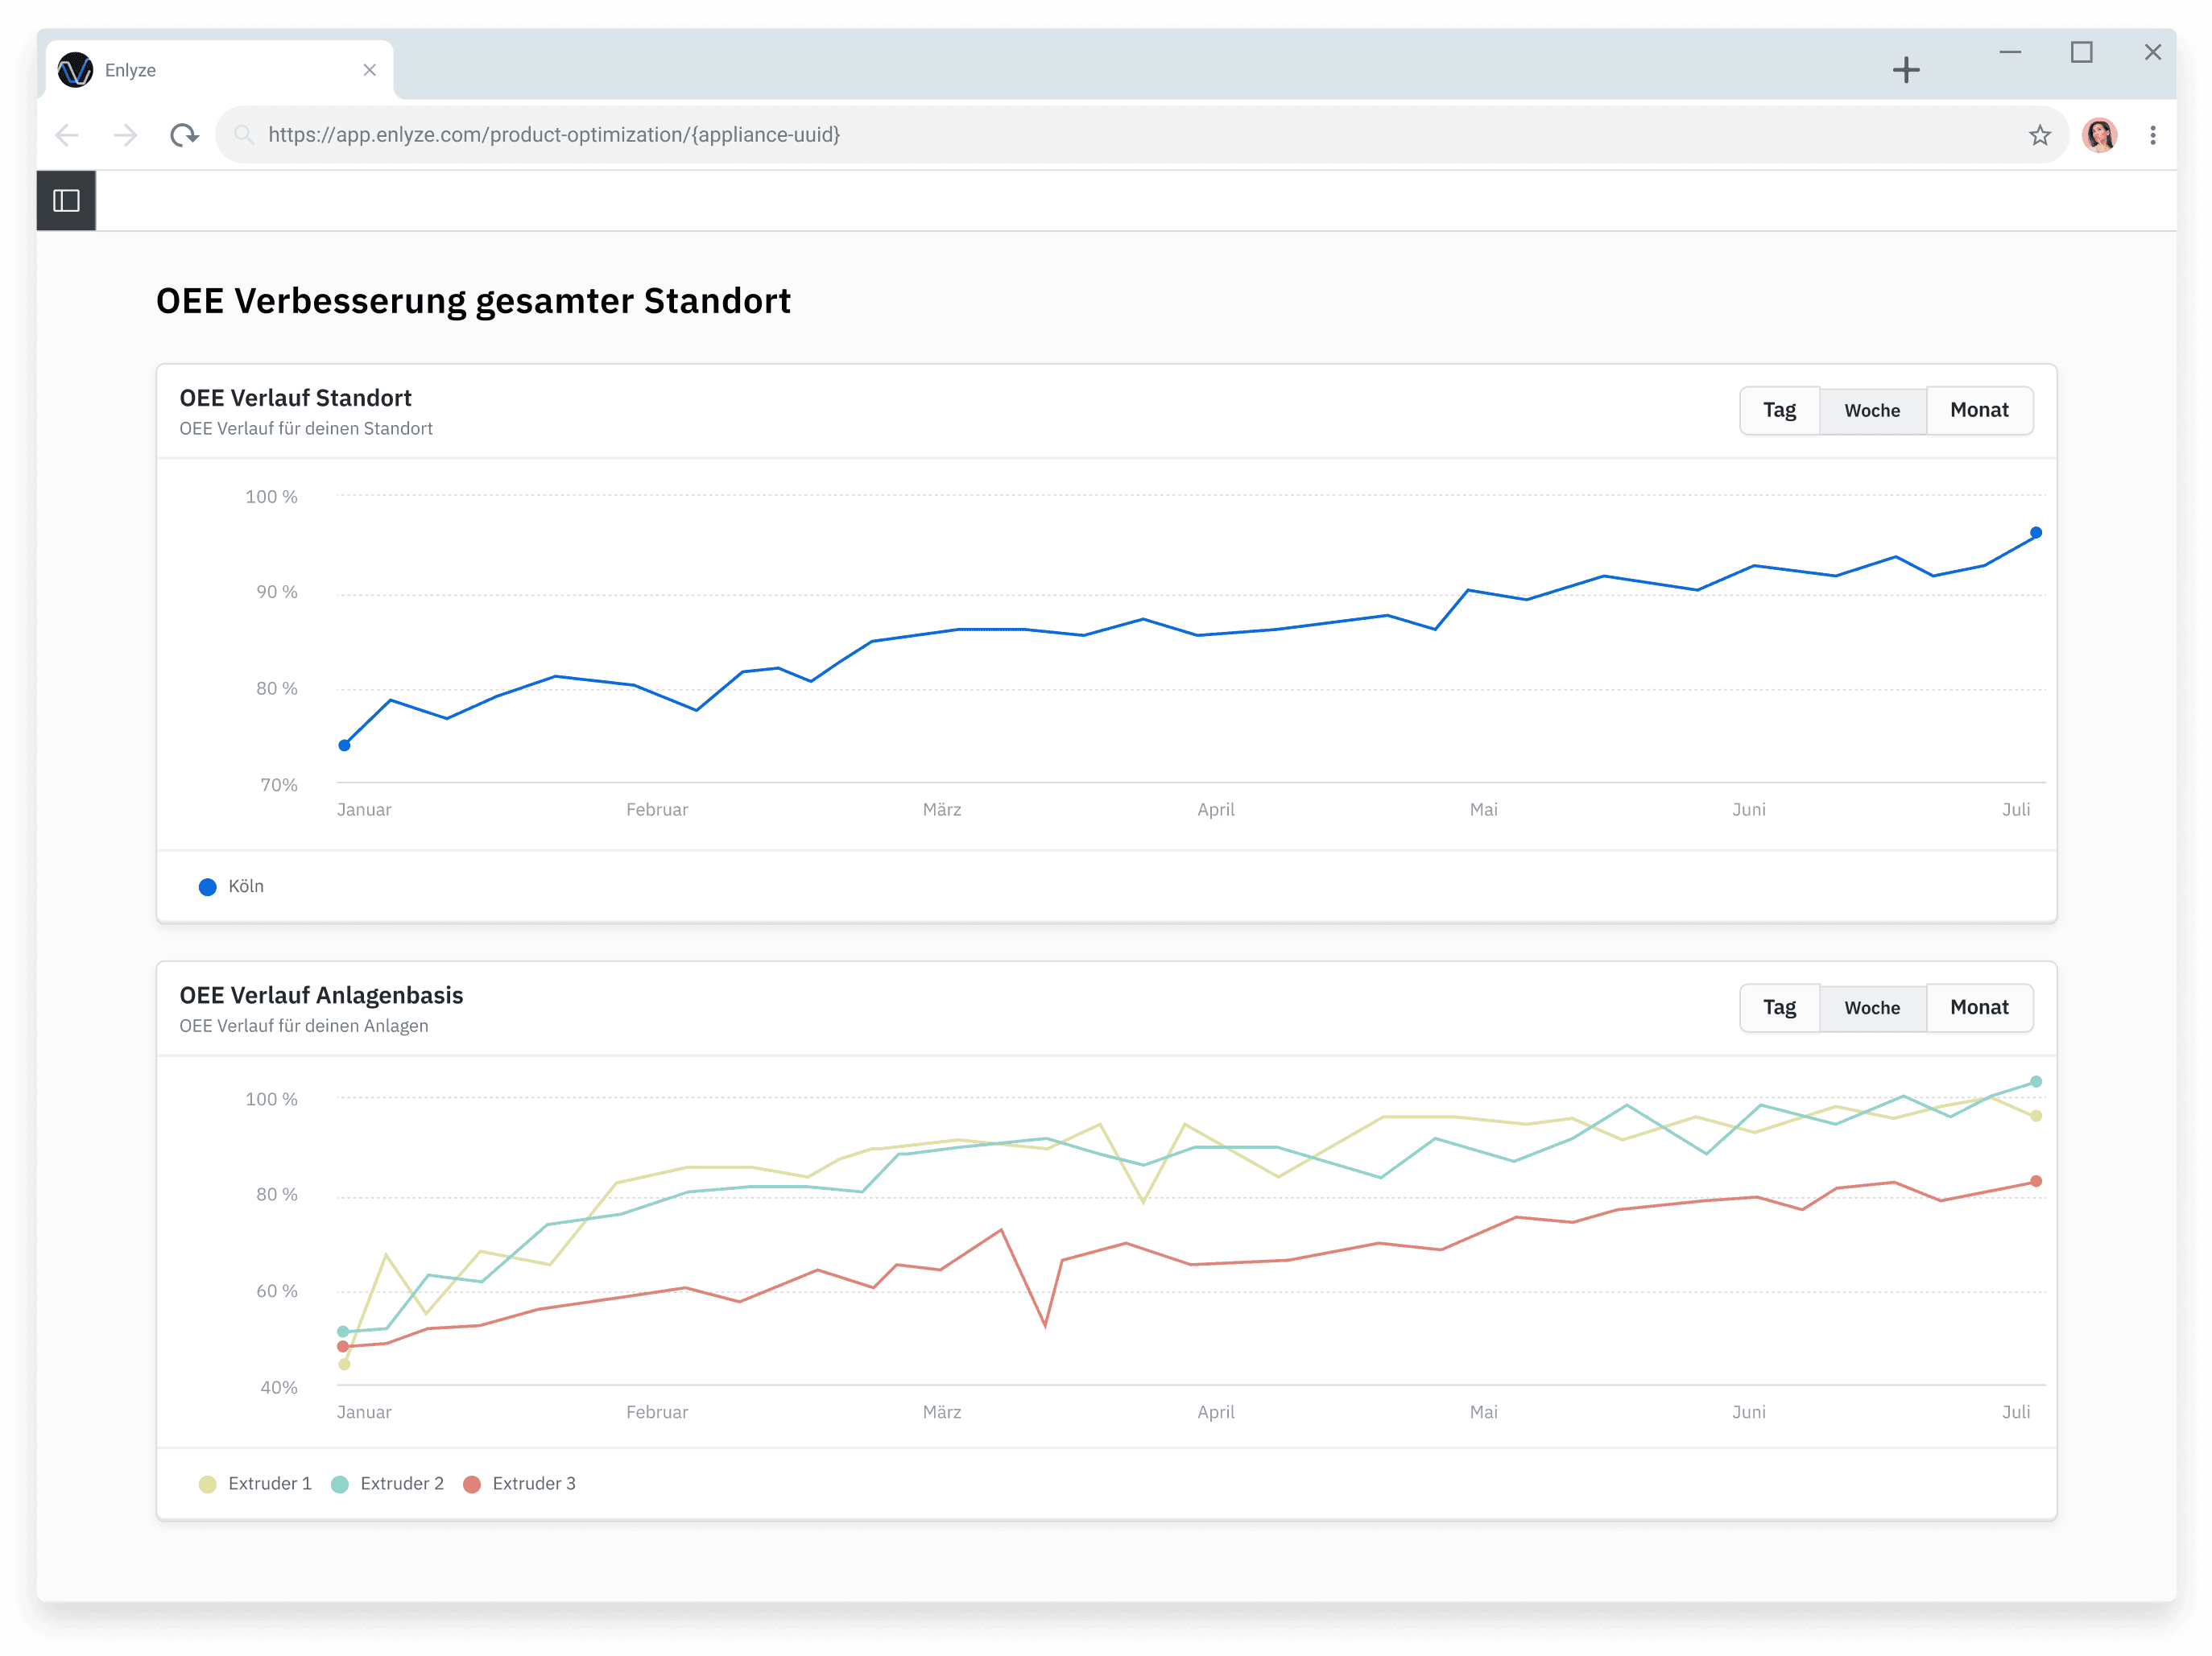
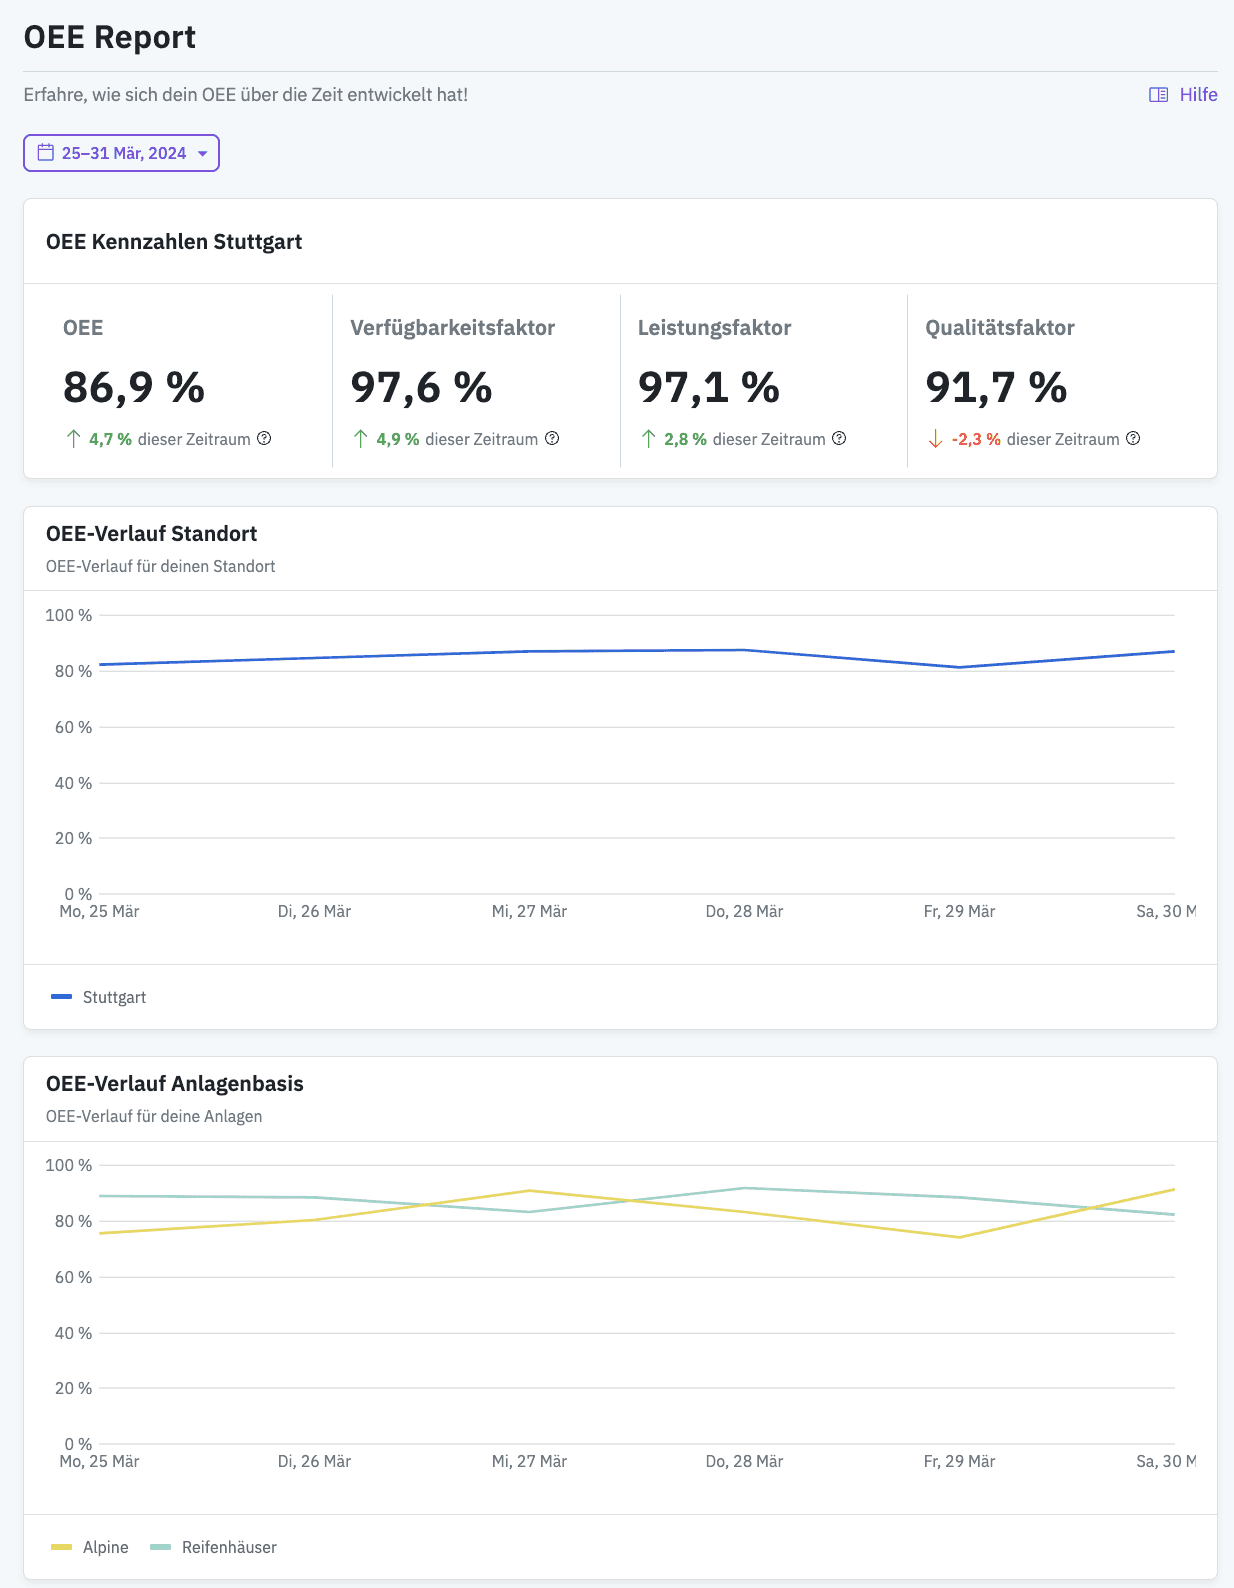
The OEE alone is already a good source of information about the status of production. However, the three components—performance, quality, and availability—and the temporal context are relevant for a detailed evaluation of productivity and the derivation of recommendations for action.
The four most important KPIs that this dashboard should display are
The current OEE, as well as the underlying factors
Availability
Performance
Quality
For a status query, it is sufficient to represent these four values in simple text boxes. For a detailed representation of OEE development, line charts are practical, showing the OEE for individual locations or plants over a certain period to clarify whether a drastic change in OEE is due to the entire production or just a part of it.
If the above dashboard is too cluttered for you and you only need a snapshot of the OEE, we recommend the following OEE overview that displays the metric and its underlying factors per plant and with a selectable calculation period. This dashboard is ideal for a quick overview of your production status.
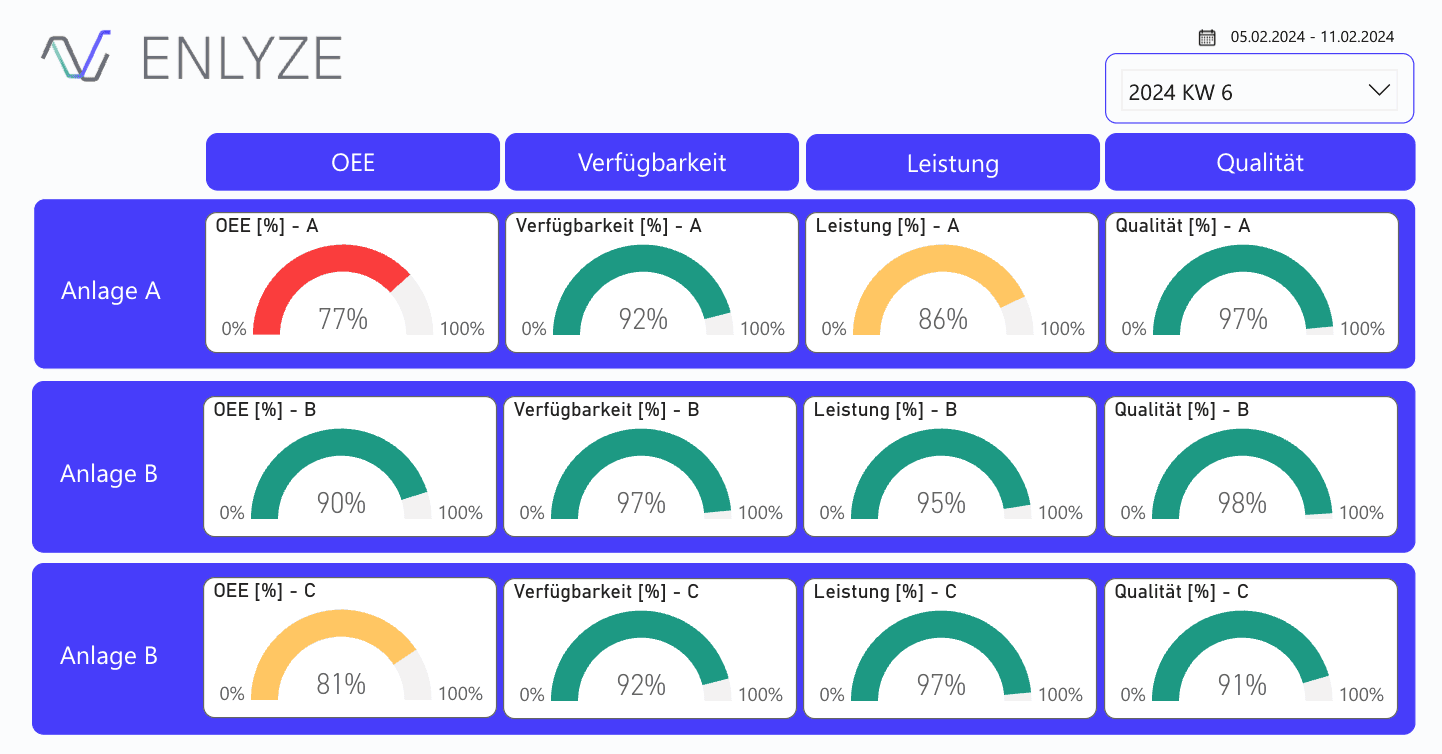
(Example: ENLYZE PowerBI)
2. Downtimes
(Example: ENLYZE App)
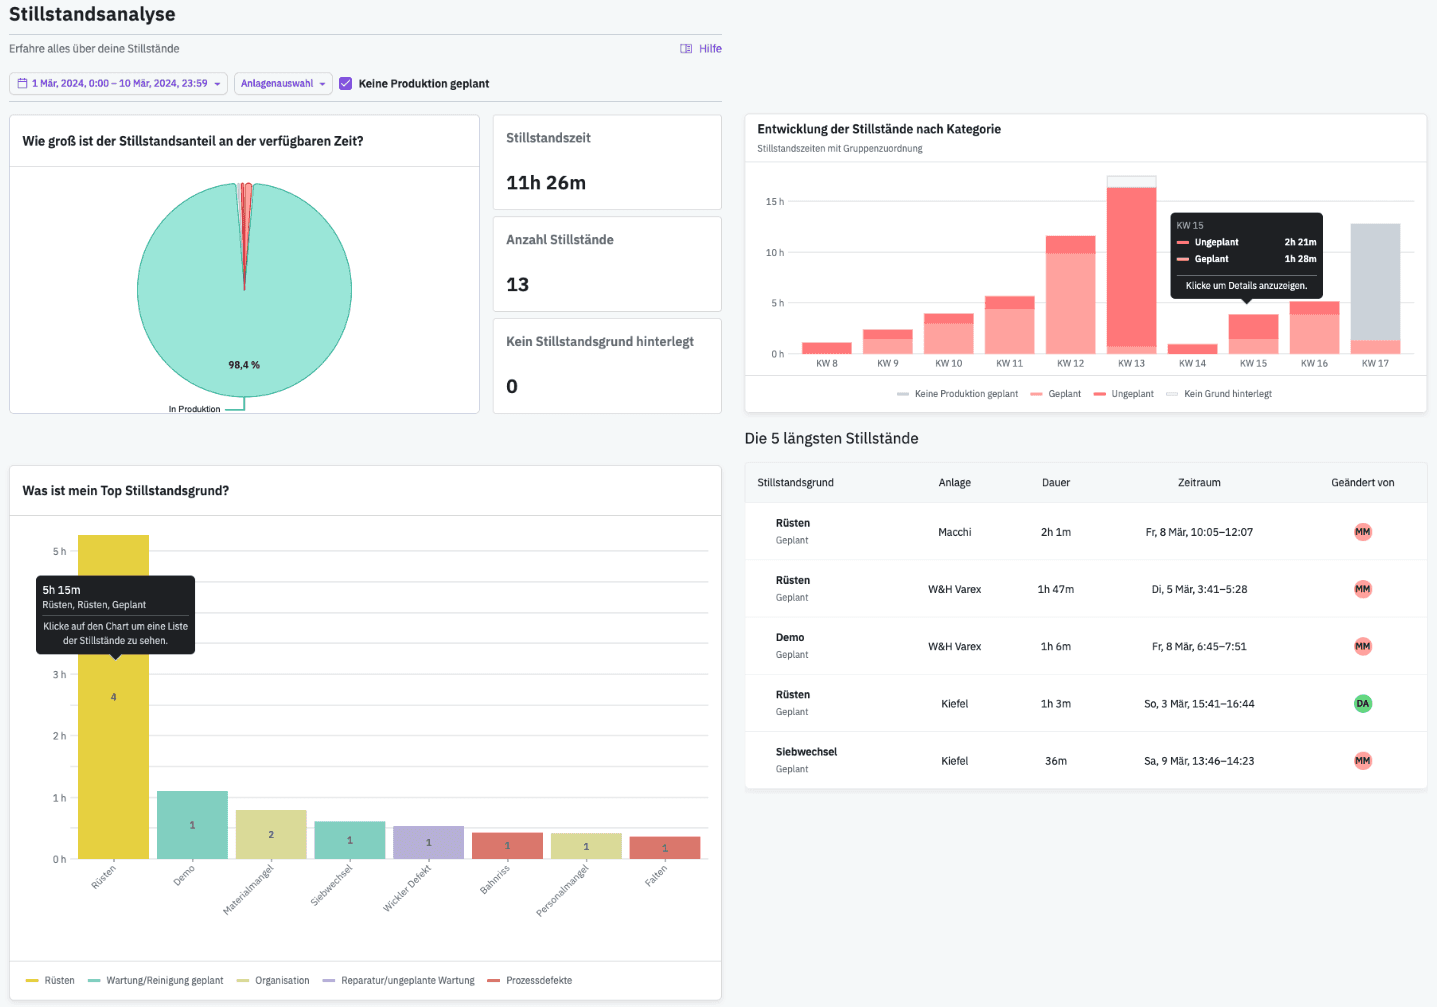
Downtimes influence the availability factor of the OEE. Therefore, this dashboard should illustrate,
why the availability is particularly high or low
whether any fluctuations in the factor are due to all or just a few machines.
Unlike monitoring dashboards that display downtimes, for example, on timelines or are interested in the current status of the plant, the goal here is to visualize the reasons for any OEE fluctuations.
For this, a summary of the downtimes is first needed. This can be effectively achieved using a pie chart that proportionally depicts production time and downtime.
For the absolute downtimes, the total duration of the downtimes in the chosen period as well as the number of downtimes are effective status indicators. This creates an intuitive overview of the frequency and severity or duration of downtimes.
As the causes of recorded downtimes are particularly important for an effective evaluation, it is also worthwhile to display the number of downtimes without a specified reason. If the availability factor is very low, the primary question becomes which downtime reason caused the most time losses.
A bar chart with downtime reasons on the x-axis and total downtime with that reason on the y-axis is practical for answering this question and provides, in combination with a listing of the five longest downtimes, clues for possible changes in the availability factor.
3. Performance
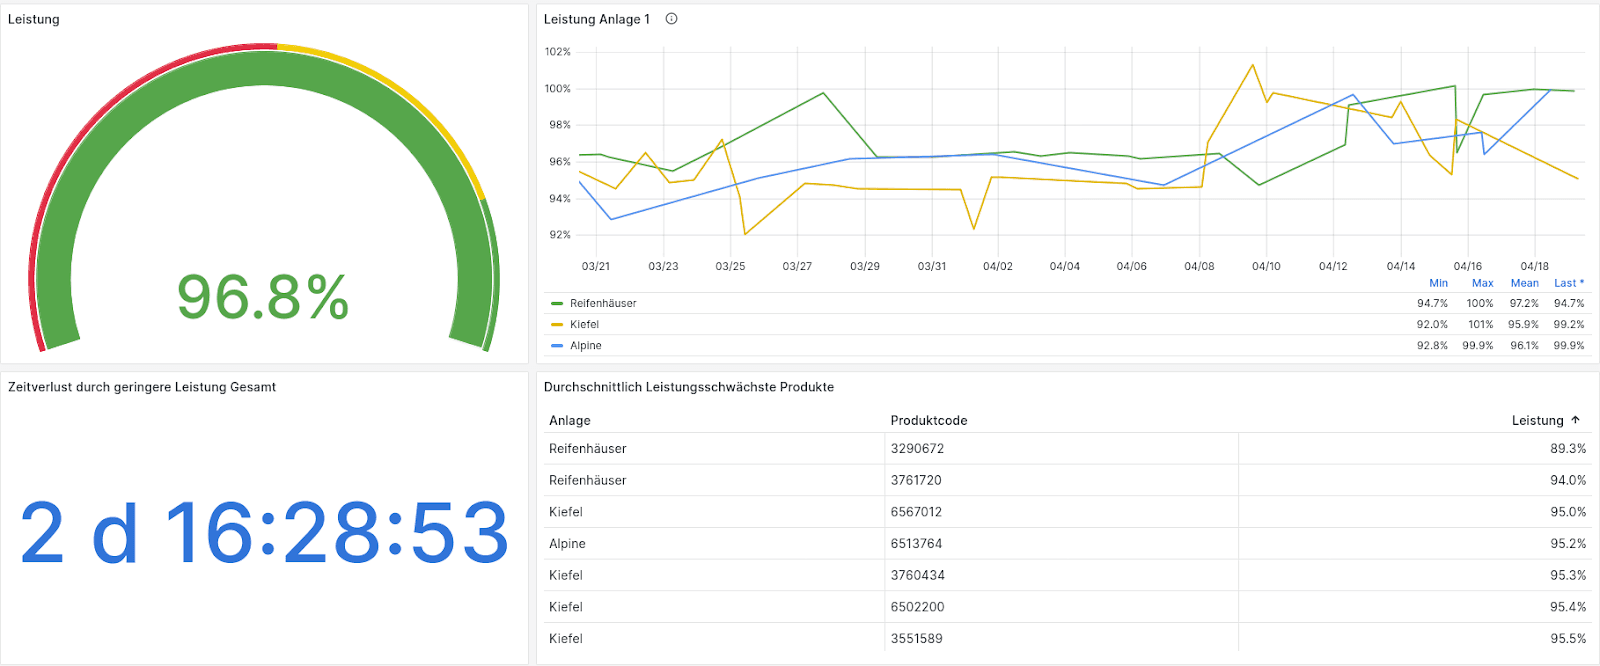
(Example: ENLYZE Grafana)
To clearly summarize the performance of your production, a dashboard that shows both the current performance of all machines and the temporal progression of performance at the individual machines is useful. This allows needs for action to be easily assessed and identifies which machines are performing the best or worst.
To further determine the causes of performance losses, it is also practical to list the products with the lowest performance factor. It is important to also display the machine on which the product was manufactured, as the same product can be produced at different speeds on different machines.
Finally, we want to quantify the improvement potential by listing the total time loss due to inefficient production. This is calculated from the difference between the actual production speed and the Maximum Demonstrated Speed (MDS), i.e. the maximum possible production speed per product and machine.
4. Quality
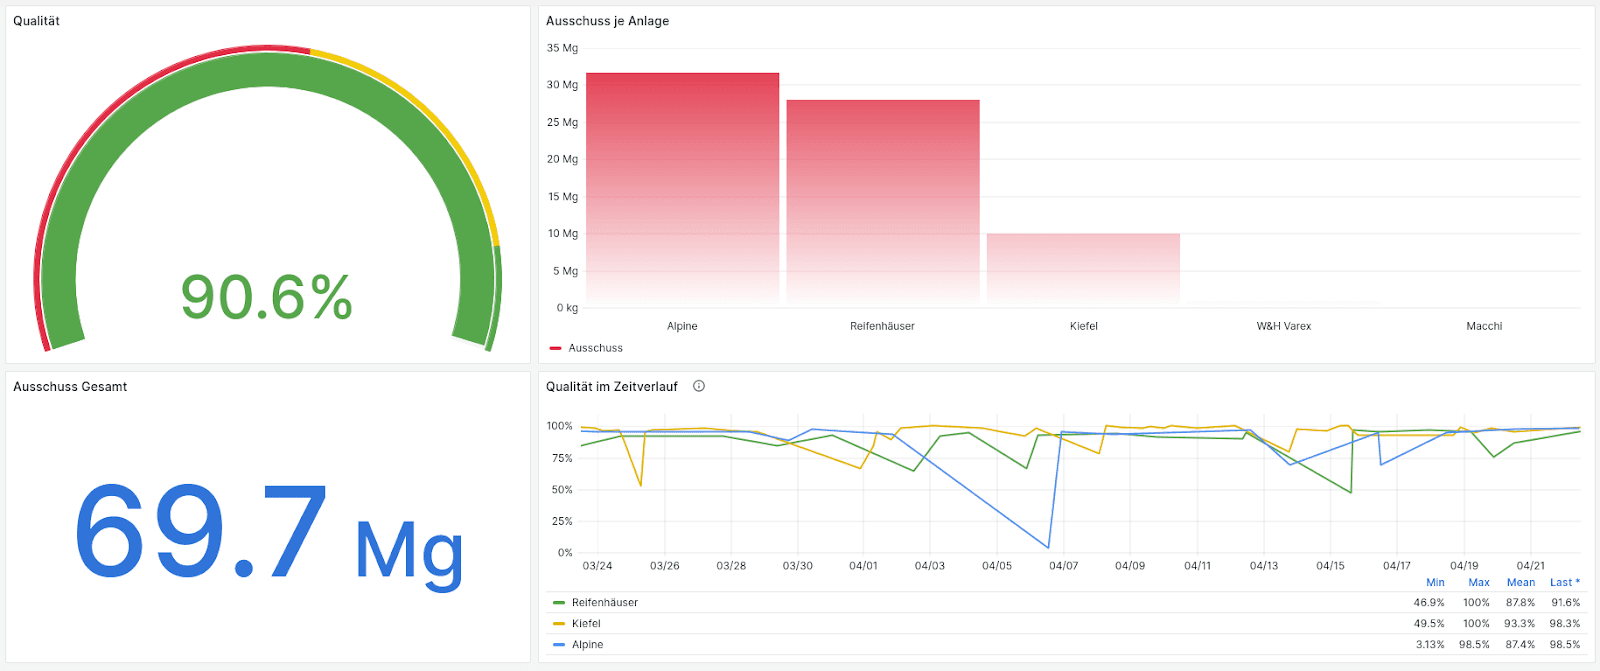
(Example: ENLYZE Grafana)
For a dashboard regarding product quality, a similar structure can be chosen as for the performance factor. The quality factor is significantly influenced by the amount of scraps, the total value of which in a freely selectable period is interesting to get an overview of the extent of quality losses.
Ordering the plants by the amount of scraps in a bar chart helps identify the plant with the highest need for action, and displaying quality per plant over time aids in further analysis and validation of the findings from the other visualizations.
As in the other dashboards, it is also important here to visualize a combination of absolute values (scrap in kilograms) and relative values (quality factor in percent) to act according to one's own production goals.
Those who want to reduce costs in the form of scrap should focus more on the bar chart with absolute values, while those who place emphasis on high quality throughout the entire production should work more with relative values. Ultimately, only the interplay of all values can accurately represent reality.
Templates for OEE Dashboards
To make it easier for you to create your own OEE dashboards, we have put together a few templates for you:
With our OEE calculator, you can quickly and easily determine the OEE for your plants and recognize potential for your production.
There is also an OEE calculator template for PowerBI that allows you to calculate and visualize the OEE similarly to our Excel template.
Since Grafana is not primarily used for OEE dashboards, we do not offer a template here but recommend working with the ENLYZE Grafana Server, which allows you to use our OEE software and provides professional support for setting up your own dashboards.
Become an OEE Expert with our OEE Series
Here you will learn how to calculate and improve the OEE in the long term.
Special considerations for OEE calculation for continuous processes
Performance losses: Why doesn't the machine always operate at maximum speed?
Read more


